 |
 |
Conference Papers
Exploring the Coastline....
Jim Bowler,

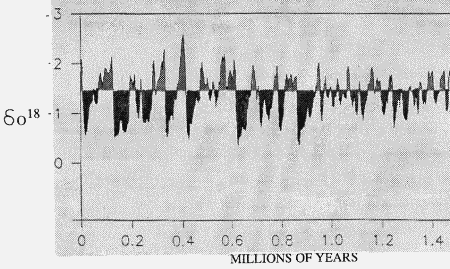
Fig. 1. Pattern of sea level changes spanning the last 1.4 million years deduced from oxygen isotope analyses of foraminiferal shells. High negative values correspond to warm interglacial periods. More positive (black) values designate cold glacial, low sea level phases (Shackleton, 1989).