 |
 |
Conference Papers
Exploring the Coastline....
Jim Bowler

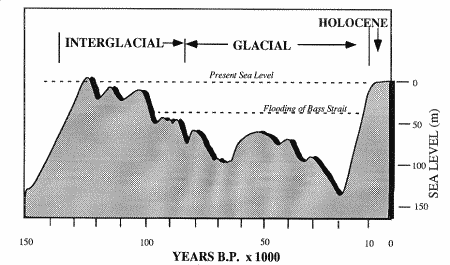
Fig. 2 Detailed sea level curve for last 150,000 years showing pattern of changes through last glacial cycle. Note the relatively short time that the sea has occupied its present position. The shore last stood near its present position some 120,000 years ago (from Chappell, 1990).