Home | About MESA | Contact MESA | Seaweek | Site Resources | Marine Links | International News | MESA History
  VELS - Allowing marine studies to come to life    
   

VELS - Allowing marine studies to come to life
What I learned at the courses of 2005

New Ripples

This system is much easier for beginners and when time is short, either to train students or when you have limited time at a reef. The program comes with a results spread sheet that can give students instant feedback to whether the reef they have looked at is healthy or not.

A healthy reef would be expected to have a majority of corals with scores over 3, a few corals with scores of 2 and a very small number of corals with a colour score of 1. The distribution graph would be similar to the graph below.


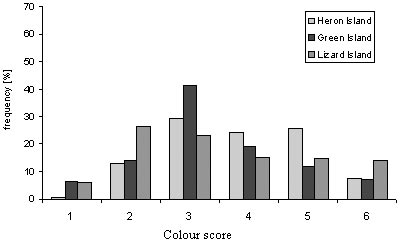
Coral Health Chart surveys on Heron, Green
and Lizard Island during July 2002

An unhealthy reef would have a lot more 1’s and 2’s and few or no higher numbers than can be seen in the above graph.

I can see students understanding how to use this and get good data for the organizers and researchers and look forward to teaching and using this next time we visit Fiji and its coral reefs.

The importance of education, sampling and data collection was driven home after attending the conference at the research station on Heron Island. You can take observations and record what you see or in a controlled way get samples and use them in experiments that give much more information and give a better understanding to what you have been educated about. At present, education and observation data collection in this field is undertaken by our students.

Next     


Search site


   Contact Web Manager © MESA 1999 - 2015
0.00098 secs   
     SpiderByte Web Design Top