Theme
Exploring Our Oceans - Oceanography from Space
Investigation 2 - Phytoplankton Distribution
Activity 1 - A Feast of Plankton
Use the map of phytoplankton distribution to answer these questions.
Use the scale to determine where there are lots of phytoplankton.
In general, where do you find areas with higher phytoplankton levels? In the middle of the ocean or close to the continents?
Based on information you have from the satellite images predict where you would find major fisheries of the world (where there are cold water currents or cold water upwellings).
Research the locations of major fisheries of the world (Peru and Chile share one of these). Compare your research findings with your predictions.
In Australian summer many whales migrate to the Southern Ocean around Antarctica to feed on the plankton rich water. What reasons can you give to explain the plankton blooms that occur in Antarctic water each year?
Activity 2 - Productivity, Biomass and Diversity
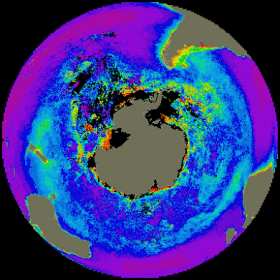
Obtain a Phytoplankton Density image of both the Arctic and Antarctic Waters by going to seawifs.gsfc.nasa.gov/SEAWIFS/IMAGES/CZCS_DATA.html
These images show the relative levels of phytoplankton in the oceans made as a composite of all Nimbus-7 Coastal Zone Color Scanner data acquired between November 1978 - and June 1986.
In comparing northern and southern hemispheres which has the greater overall levels of productivity? If we translate productivity to think about fisheries which hemisphere is likely to support larger numbers of fish? What implications does this have for fisheries managers in the Southern Hemisphere? What issues of productivity have been ignored by fisheries managers in the Northern Hemisphere in the last few decades?
Compare the northern and southern hemisphere. Which hemisphere has more land? Which oceans are likely to receive the most amounts of soil and nutrients coming from the land with streams and rivers? Can you think of why the oceans in the Northern Hemisphere may have much larger numbers of fish than the Southern Hemisphere?
Biodiversity is largely influenced by the productivity of the system. In general where productivity is lower there is greater evolutionary pressure on organisms, particularly animals, to become different to one another to take advantage of different food types. Southern Australia has some of the highest levels of biodiversity ever found on the planet. How can this be explained using the phytoplankton density data? |
 |
|